In today’s fast-paced, data-driven world, businesses thrive on making informed decisions—and that’s exactly where Power BI comes into play.If someone is preparing for a Power BI interview, understanding the key features and functionalities of Power BI is must.
It is like an all-in-one toolkit for turning raw data into clear, actionable insights through stunning dashboards and interactive reports. No wonder it’s become a favorite in the business intelligence space!
For job seekers looking to land roles like data analyst, BI developer, or reporting specialist, nailing Power BI interview questions is non-negotiable.
Employers want someone who doesn’t just know the tool but can also use it to solve real-world problems. Preparing for these power bi interview questions isn’t just about ticking a box—it’s about showing up confident and ready to stand out.
If you’re just starting and wondering, “What is Power BI?” or are already familiar but want to refine your skills, a Power BI course is a great way to build expertise and prepare for your next big career step.
- 1. Overview of Power BI
- What is Power BI?
- What is Power BI used for?
- 2. Top Power BI Interview Questions and Answers
- Basic Level
- Power BI Interview Questions for Freshers
- Advanced Level
- Commonly Asked Scenario-Based Questions for Power BI
- 3. Power BI vs Tableau
- 4. Tips for Cracking Power BI Interviews
- 5. Conclusion
- 6. FAQs
Table Of Content
Overview of Power BI
What is Power BI?
Let’s break it down. Power BI is Microsoft’s powerhouse business intelligence tool. It helps you connect to all sorts of data sources, clean and shape that data, and then turn it into visual stories that make decision-making easier and smarter.
Here’s what makes Power BI awesome:
What is Power BI used for?
Power BI shines in scenarios like:
Imagine this: A retail chain uses Power BI to analyze customer shopping habits and adjusts their inventory just in time for a sale. That’s data working smarter, not harder.
Overview of Power BI Desktop
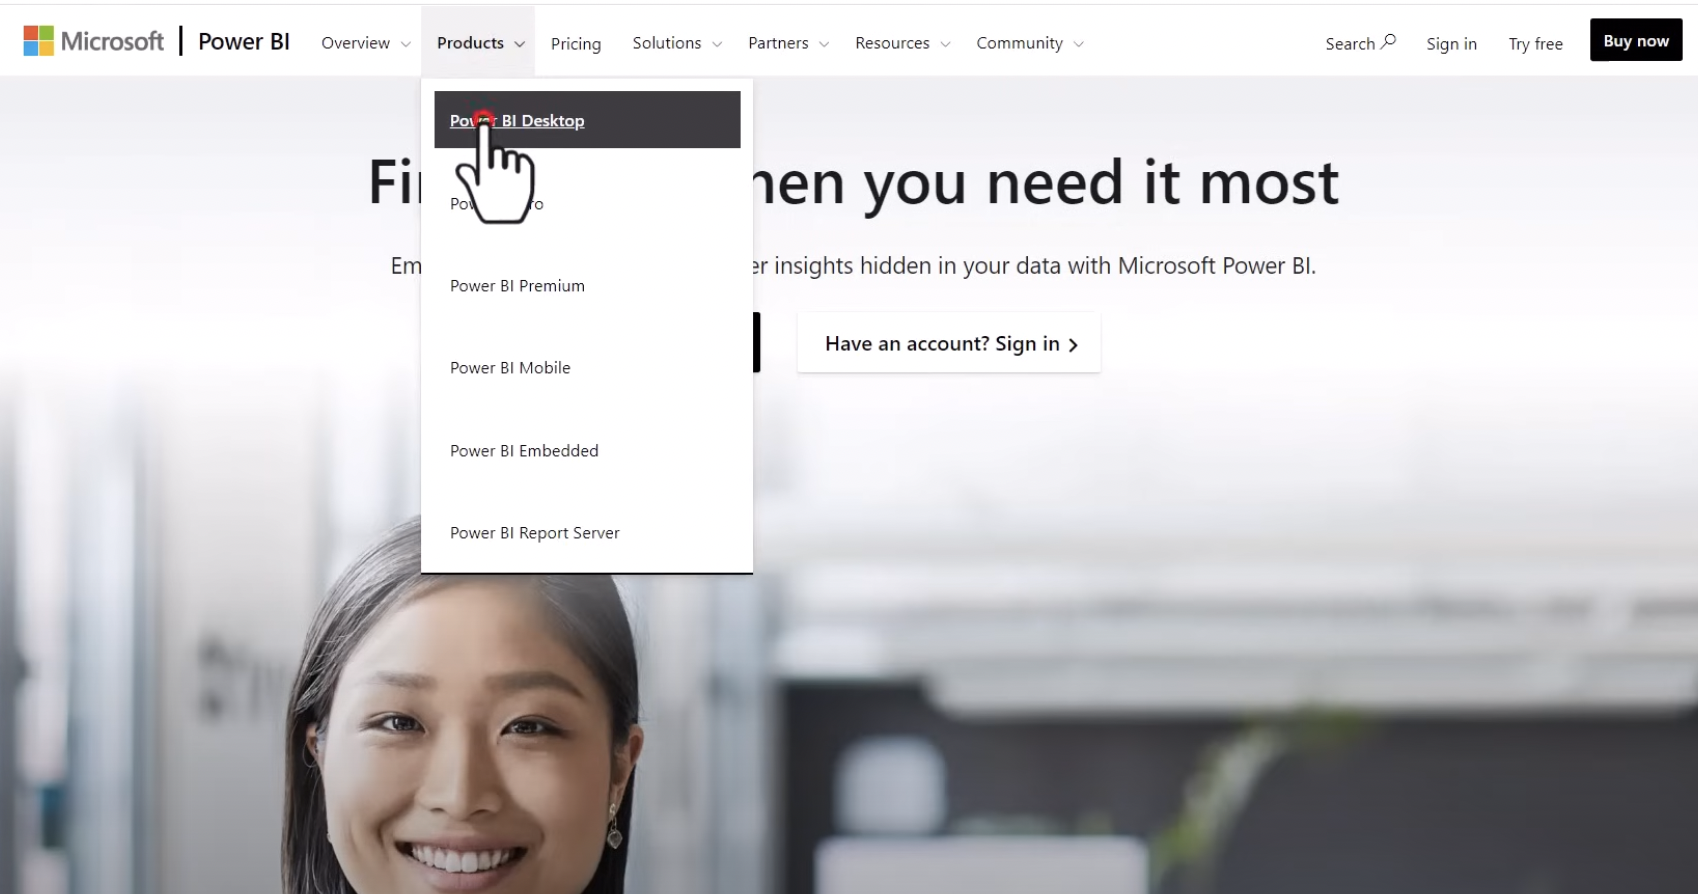
Now, let’s talk about the tool that gets everything started—Power BI Desktop. It’s the go-to application for creating data models, reports, and dashboards before sharing them with your team. With this tool, you can:
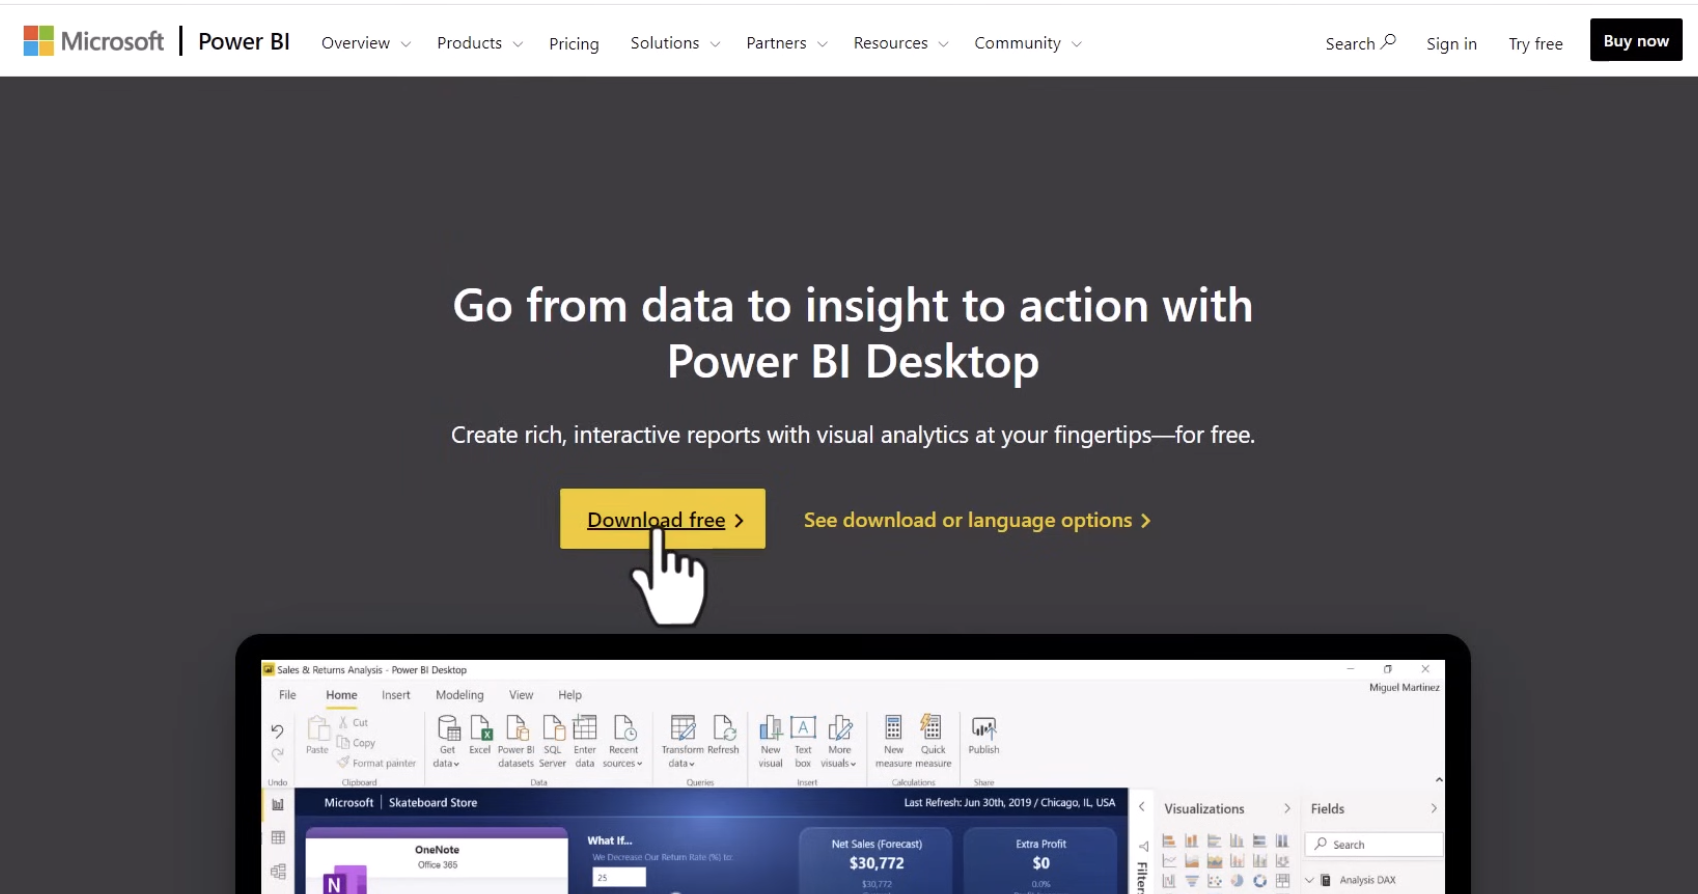
And the best part? Setting it up is super easy! Just head to the Microsoft website for a Power BI Desktop download, and you’re good to go. It’s free, beginner-friendly, and powerful enough for the pros. Whether you’re a data newbie or a seasoned BI expert, this tool is the backbone of your Power BI journey.
Top Power BI Interview Questions and Answers
This section covers commonly asked Power BI questions, categorized by difficulty.
If you’re a beginner stepping into the world of Power BI, interviewers often start with foundational concepts. Here are some commonly asked power bi interview questions for freshers, along with simplified explanations to help you ace the power bi interview:
What are Filters in Power BI?
These filters allow you to narrow down the data displayed in your visualizations. They help you focus on specific data points by excluding irrelevant information. For example, you can apply a filter to show sales data for a particular region or time period. Filters can be applied at the visual, page, or report level.
What are the different types of visualizations available in Power BI?
Power BI offers a range of visualizations, including:
Each visualization serves a specific purpose, such as comparing values, showing trends, or representing geographical data.
What is DAX is and why it's important?
DAX (Data Analysis Expressions) is a formula language used in Power BI to create custom calculations and aggregations.
It’s similar to Excel formulas but designed for relational data. For example, you can use DAX to calculate Year-over-Year growth, create dynamic measures, or filter data dynamically in visuals.
What are the key components of Power BI?
Power BI is made up of three main components:
How does Power BI handle data refresh?
Power BI supports two types of data refresh:
What is a Power BI dashboard?
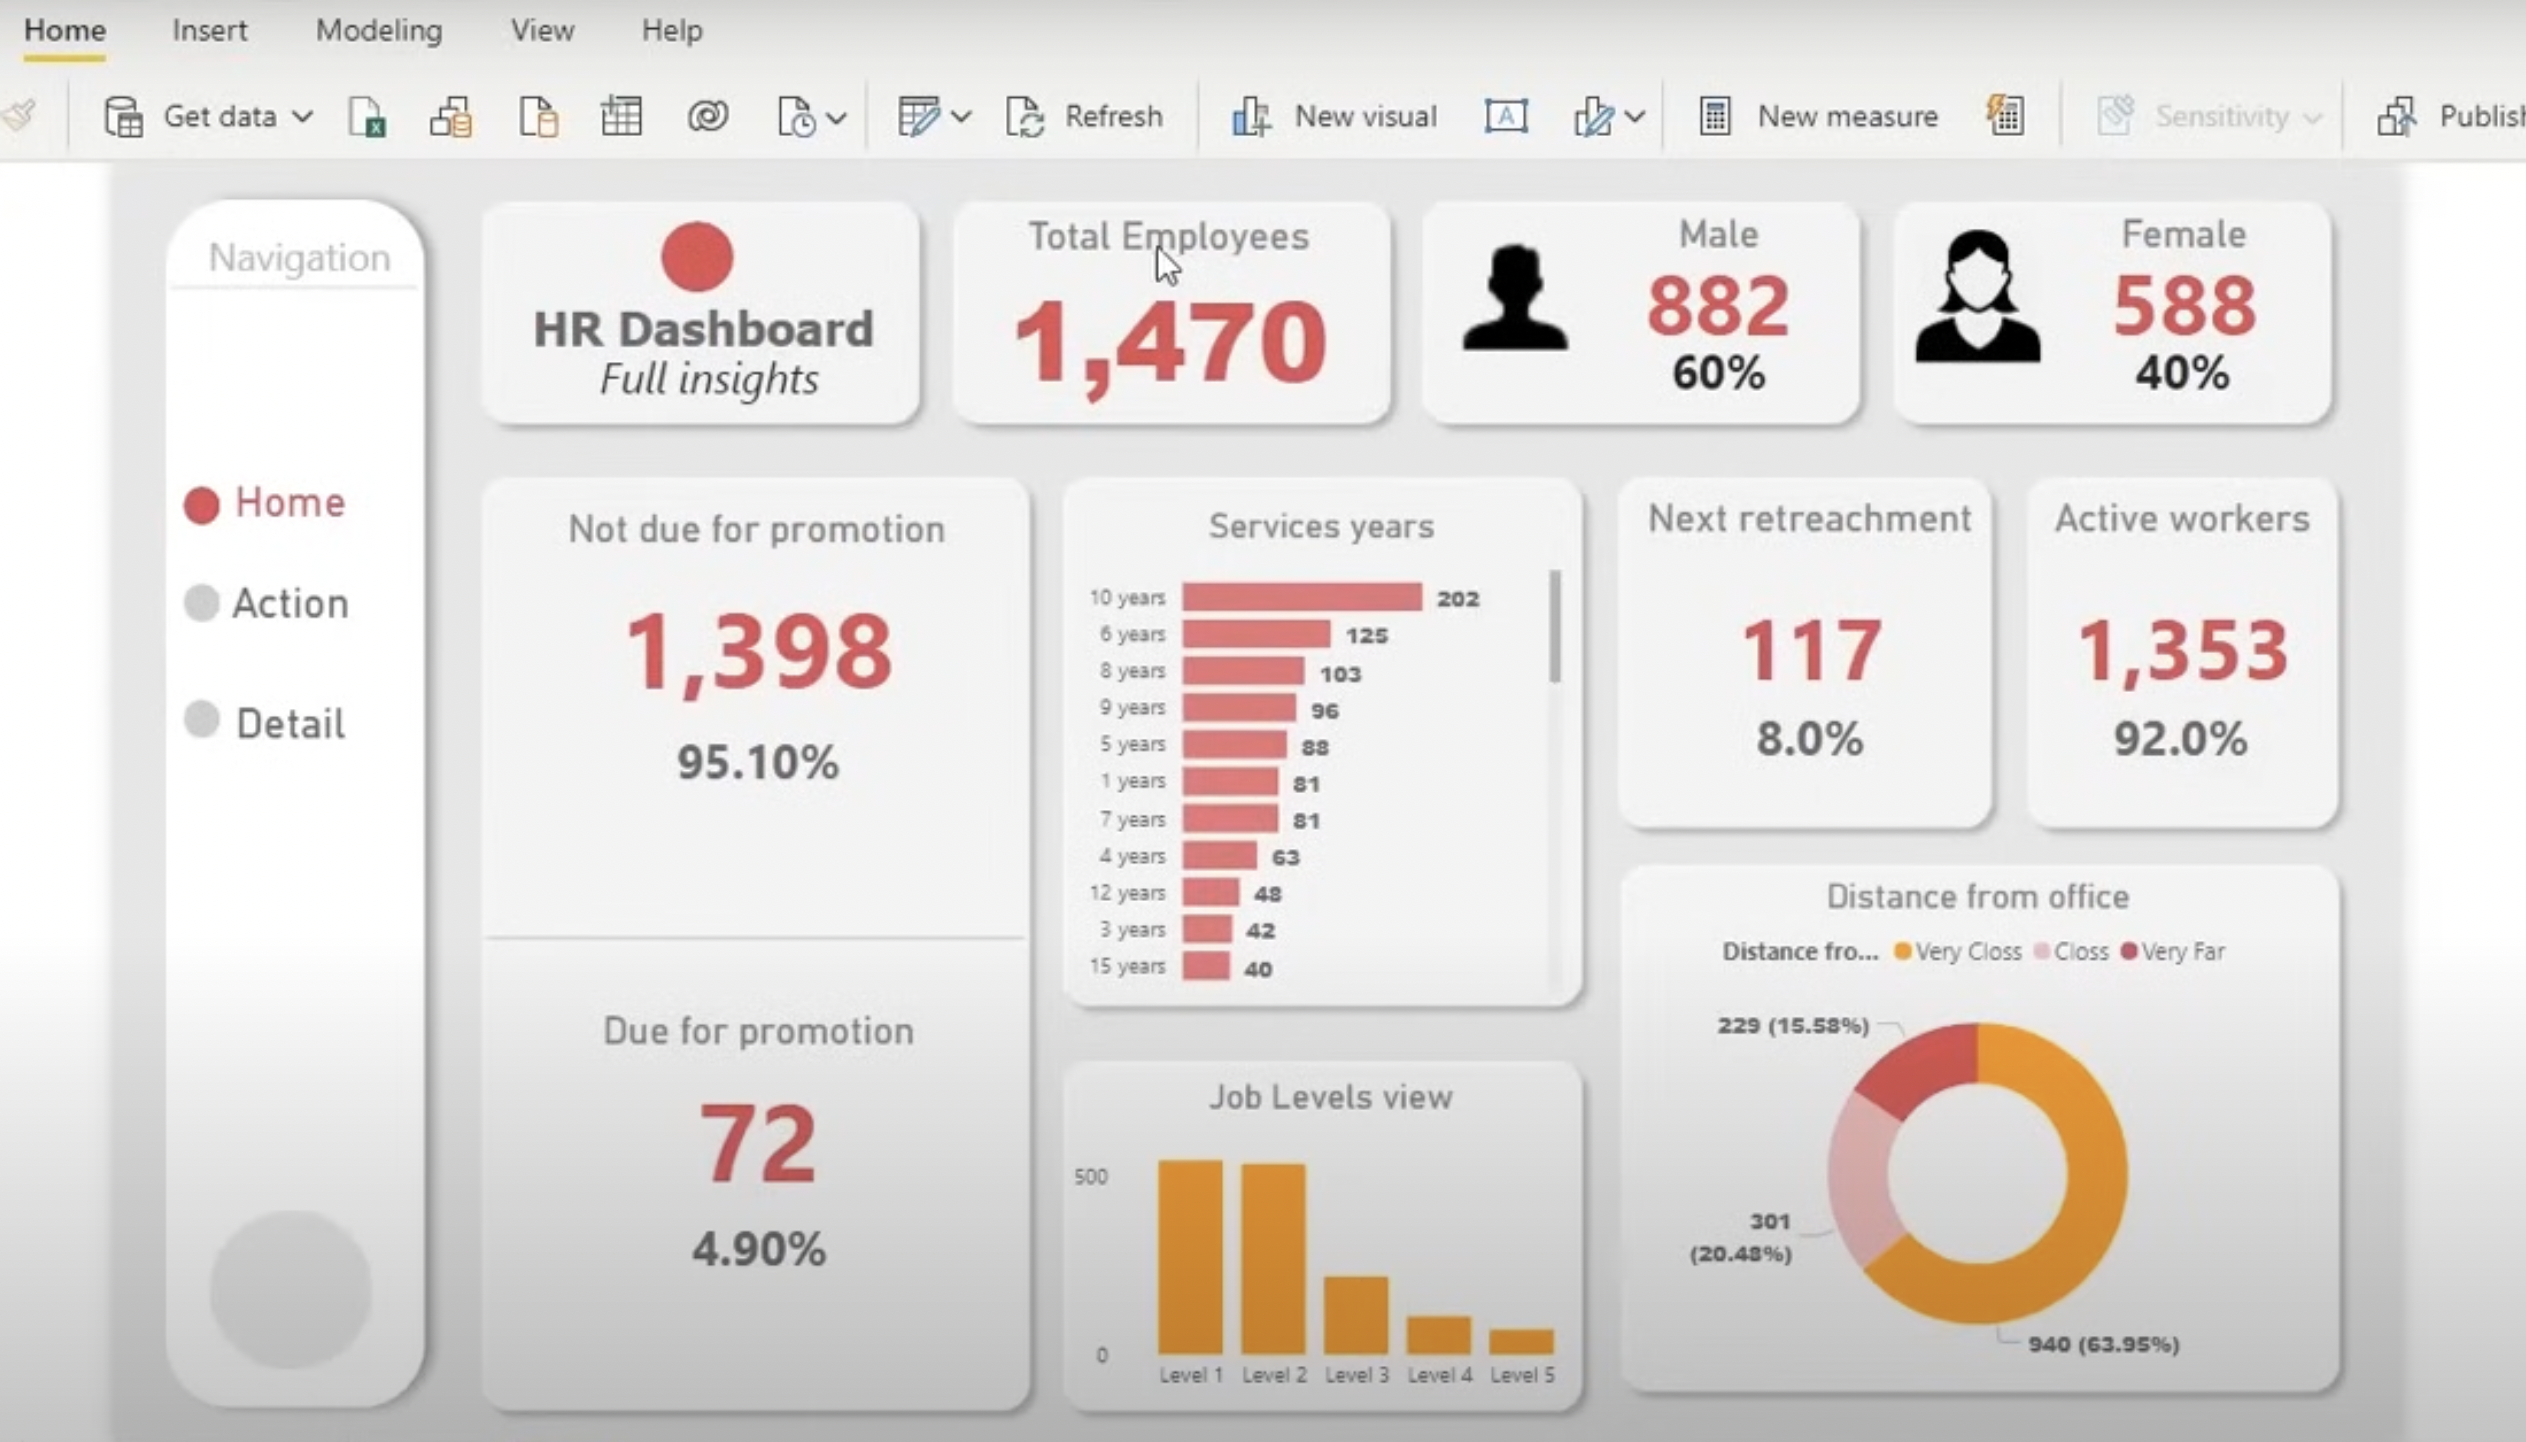
A Power BI dashboard is a collection of visuals from one or more reports. Dashboards are interactive, allow cross-filtering, and provide a 360-degree view of your data at a glance. However, they are read-only, meaning you cannot edit visuals directly on a dashboard.
Power BI Interview Questions for Freshers
If you’re new to Power BI, here’s a tailored list of questions that are frequently asked during entry-level interviews
What is Power Query in Power BI?
Power Query is a tool within Power BI used for connecting to various data sources and performing data transformation tasks like cleaning, reshaping, and combining data. It is like a data preparation tool that feeds clean data to your visualizations.
What is the difference between a report and a dashboard in Power BI?
Reports are editable, while dashboards are static and primarily used for sharing insights.
What are calculated columns and measures in Power BI?
What is the difference between DirectQuery and Import Mode in Power BI?
How do you share Power BI reports?
Reports can be shared using the Power BI Service by:
What is the importance of Power BI’s Q&A feature?
The Q&A feature allows users to interact with data using natural language questions. For instance, you can type “Show total sales by region” in the Q&A box, and Power BI will generate a corresponding visual.
Advanced Level
Let’s focus on Advanced Level questions and break down their nuances.
How do you optimize reports in Power BI?
Optimizing reports involves improving performance and user experience. Here are some key techniques:
What are custom visuals, and how do you create them?
Custom visuals are personalized visualizations that go beyond the standard visuals in Power BI. These are especially useful for unique business requirements. You can:
Create custom visuals using Power BI Developer tools and code them in TypeScript.
Publish them to AppSource or import them directly into your reports.
Download pre-built custom visuals from Microsoft’s marketplace.
How does Power BI handle large datasets?
Power BI efficiently manages large datasets using:
What is the role of a gateway in Power BI?
A gateway acts as a bridge between on-premises data sources and the Power BI service. It ensures secure data transfer for refreshing datasets and live queries. Types of gateways include:
Explain row-level security (RLS) in Power BI. How is it implemented?
RLS restricts data access based on user roles. It ensures users only see data they’re authorized to view. Steps to implement RLS:
What are the differences between Power BI dashboards and reports?
How can you manage and schedule data refreshes in Power BI?
Data refreshes ensure your visuals display the latest data. To manage this:
How is DAX used in Power BI? Give example.
DAX stands for Data Analysis Expressions. It’s a formula language used to create calculated columns, measures, and custom tables. For example:
Can you explain the difference between Import and DirectQuery modes?
How do you handle errors in Power BI?
Errors can occur in data sources, transformations, or visualizations. Some solutions include:
Commonly Asked Scenario-Based Questions for Power BI
Scenario-based questions are often used in Power BI interviews to assess a candidate's practical knowledge and problem-solving skills.
These questions typically involve real-world use cases, where the interviewer expects the candidate to demonstrate how they would apply Power BI features to solve business challenges.
1. Scenario: You have a dataset with multiple tables, including sales, customers, and products. How would you establish relationships between these tables in Power BI to ensure accurate reporting?
To establish relationships in Power BI, first, ensure that the tables are connected through key columns (e.g., CustomerID, ProductID). You can create relationships by going to the "Model" view and dragging and dropping fields to connect tables.
Be mindful of cardinality (one-to-one, one-to-many, or many-to-many) and choose the correct relationship type. This ensures that Power BI can aggregate and filter data across multiple tables correctly.
2. Scenario: You need to create a sales report that includes both current sales and year-over-year (YoY) comparison. How would you approach this in Power BI?
For a YoY comparison, you could use DAX (Data Analysis Expressions) to create measures that calculate the previous year's sales. Use the SAMEPERIODLASTYEAR() function to get the sales from the same period last year and calculate the difference or percentage change.
A combination of time intelligence functions and visualizations like bar charts or line graphs would help make the comparison clear.
3. Scenario: You have a table with hundreds of rows of data, but users only need to see records for a specific region. How would you optimize this in Power BI?
To optimize the report for a specific region, you can use Power BI's slicers or filters. Create a slicer for the region column, allowing users to filter data based on their selection.
Alternatively, you could use row-level security (RLS) to restrict data access, ensuring that users only see the relevant data for their region. This will enhance performance and ensure data security.
4. Scenario: Your dataset has missing values in critical fields like revenue and sales. How would you handle these gaps in Power BI to ensure accurate reporting?
Missing data is common in datasets, and Power BI offers several methods to handle it. One option is using Power Query to fill in missing values with default values or impute them based on the surrounding data.
You could also apply conditional logic in DAX to handle these gaps by substituting missing values with zero or calculating averages, depending on the context.
5. Scenario: A client needs to see a detailed breakdown of product sales by region and product category, with a focus on specific sales periods. How would you design a report to meet these requirements?
To meet this requirement, you would design a multi-dimensional report using filters and slicers for region, product category, and time period. Use Power BI's hierarchy feature to allow users to drill down from high-level categories (e.g., region) to specific products.
You could use matrix visuals, which allow users to view data at different granularities, and line or bar charts to show trends over time. Setting up time-based slicers or using relative date filters will let users focus on the required time periods.
6. Scenario: You need to create a dashboard that shows both the total revenue and profit margin by department in an organization. How would you approach this?
In this case, you would create two separate measures using DAX: one for total revenue and another for profit margin. You can then display these measures in visuals like bar charts or KPI indicators for each department.
Make use of Power BI's conditional formatting options to highlight departments that exceed or fall short of performance targets. This type of dashboard helps stakeholders quickly identify areas for improvement.
7. Scenario: You need to create a report that includes data from multiple sources, such as an Excel sheet, a SQL Server database, and an online API. How would you integrate and manage these different data sources?
Power BI makes it easy to connect to various data sources. You can use Power Query to import data from Excel, SQL Server, and an API. When combining these sources, it’s crucial to clean and transform the data using Power Query's built-in tools.
For example, if there are discrepancies in field names or formats, you can adjust them in the "Transform Data" window. Once data is loaded, ensure that the relationships between tables are correctly defined to avoid data inconsistencies.
8. Scenario: You are working with a time-sensitive report, and the data refresh takes longer than expected. How would you address this issue?
To improve the performance of your report, start by optimizing the data model. Ensure that you are using efficient data types and removing any unnecessary columns or tables.
You can also utilize Power BI's incremental data refresh feature, which only refreshes new or changed data rather than the entire dataset. Additionally, consider aggregating large datasets at a higher level, reducing the volume of data that needs to be loaded during each refresh.
Power BI vs Tableau
Candidates can also be asked to explain the difference between Power BI and Tableau during a Power BI interview. Both tools are widely used for data visualization and business intelligence, but they differ in several key aspects. Here’s a structured comparison to help clarify the differences:
Tips for Cracking Power BI Interviews
A Power BI interview can be a bit intimidating, but with the right preparation, you can showcase your skills and knowledge effectively. Here are some tips for cracking Power BI interviews that will help you impress your interviewers:
Understand the Core Concepts
Power BI interviews often test your foundational knowledge of key concepts like DAX (Data Analysis Expressions), filters, and report optimization. DAX, in particular, is a powerful language used for calculations and creating custom measures in Power BI.
Be prepared to explain how to write basic DAX expressions, such as SUM, AVERAGE, or CALCULATE, and when to use them in reports. Similarly, understanding how filters work in Power BI (such as slicers, page filters, and report filters) is crucial to provide insightful, interactive reports.
Structured Answering
Interviewers often appreciate well-structured and concise answers. When asked to solve a scenario or explain a concept, break your answer down into steps. For example, if asked how to optimize report performance, you can discuss simplifying data models, reducing unnecessary visuals, or using measures instead of calculated columns.
Emphasize Problem-Solving Skills
Power BI is all about problem-solving. Often, you’ll be asked how you’d handle a challenging scenario, like dealing with large datasets, optimizing report speed, or handling missing data.
Focus on demonstrating your logical thinking, showing your interviewer that you can break down complex problems into manageable tasks and resolve them using Power BI features.
Talk About Report Optimization
Report optimization is a key skill in Power BI, especially when dealing with large datasets or complex reports. Be ready to explain techniques like aggregating data, using DirectQuery mode, and avoiding unnecessary visuals. Show your knowledge of performance tuning to ensure reports load quickly and are user-friendly.
Conclusion
Preparing for a Power BI interview is crucial to securing a role that involves data analysis, business intelligence, or reporting.
In this blog, we've covered essential Power BI questions. However, interview preparation doesn't end with just knowing the Power BI interview questions and answers. Continuous learning and skill enhancement are essential to stay ahead in the field.
To boost your knowledge and expertise, consider taking a Power BI course that will improve your technical proficiency and provide you with practical experience. It offers the ideal platform for anyone looking to upskill in Power BI.
FAQs
1. Why is Power BI so popular?
It is so popular because it enables businesses to make data-driven decisions efficiently.
2. Can I use Power BI without an advanced technical background?
Yes, absolutely! Power BI Desktop is quite user-friendly, and even if you're a beginner, you can start by learning the basics. Over time, you can move on to more advanced topics like DAX (Data Analysis Expressions) and Filters in Power BI.
3. What is the best way to prepare for Power BI interviews?
The best way to prepare for interview questions on Power BI is by practicing real-world scenarios and understanding the core concepts like data modeling, report creation, and DAX functions. Reviewing a comprehensive Power BI course can help reinforce these skills and boost your confidence.
4. What career opportunities are available for Power BI professionals?
Power BI is one of the most in-demand skills in data analysis and business intelligence. As a Power BI professional, you can explore a variety of career paths, including:
Data Analyst: Focus on transforming raw data into actionable insights using Power BI.
Business Intelligence Analyst: Work with complex datasets, creating visualizations and reports for decision-makers.
Power BI Developer: Design and develop Power BI dashboards and reports for organizations.
Data Scientist: Leverage Power BI to visualize complex data sets and communicate findings.
Consultant: Provide businesses with Power BI solutions and help them make data-driven decisions.
5. How can I transition into a Power BI career with no experience?
If you're transitioning into a Power BI career without prior experience, start by gaining hands-on experience with Power BI tools. Begin with basic reports and dashboards, and as you grow, explore advanced topics such as DAX and data modeling.
Participating in some courses and getting certified can boost your credibility and make you a more attractive candidate for entry-level roles. You can also look for internship opportunities or freelance gigs to build your portfolio.
6. How can I prepare for Power BI interviews if I have no prior experience?
If you're a fresher or someone with limited experience, focus on mastering the fundamentals of Power BI. Understand basic concepts such as data import, transformations, and visualization.
Be ready to discuss your academic projects or any hands-on practice you've done with Power BI. It's also important to understand what Power BI is used for and its features and how they help with data analysis.
7. What is the career progression for someone skilled in Power BI?
Career progression for Power BI professionals can vary, but here’s a typical path:
Entry-Level: As a Data Analyst or Business Intelligence Analyst, you’ll work on data extraction, transformation, and visualization.
Mid-Level: With a few years of experience, you can move into roles like Power BI Developer, Data Scientist, or Power BI Consultant, focusing on more complex data analysis and creating customized reports.
Senior-Level: At the senior level, you might become a BI Manager, overseeing a team of analysts and developers, working with business leaders to shape the organization’s data strategy.
Specialized Roles: With advanced expertise, you could also branch into data architecture or AI/ML roles that integrate with Power BI.
8.How long does it take to become proficient in Power BI?
The time it takes to become proficient in Power BI depends on your learning style and previous experience with data analysis tools.
If you're starting from scratch, it might take around 3 to 6 months of consistent practice to become comfortable using Power BI Desktop and creating dashboards. For deeper proficiency, such as mastering DAX and advanced features, it may take longer.
9. What is the Power BI interview process like?
The Power BI interview process typically involves multiple stages. First, you might face a technical screening where you’re asked to demonstrate your knowledge of Power BI features, DAX, and data modeling.
Some companies may also provide a case study or practical test where you’ll need to work with sample data and create a report or dashboard.
In addition to technical questions, you’ll likely be asked about your experience with data visualization tools and your problem-solving skills.
By preparing well, continuing to upskill, and staying curious, you can build a rewarding career in Power BI. Whether you're just starting or already have experience, the opportunities in Power BI are vast and continue to grow.
.png)


.png)
 (4).png) Call Now
Call Now